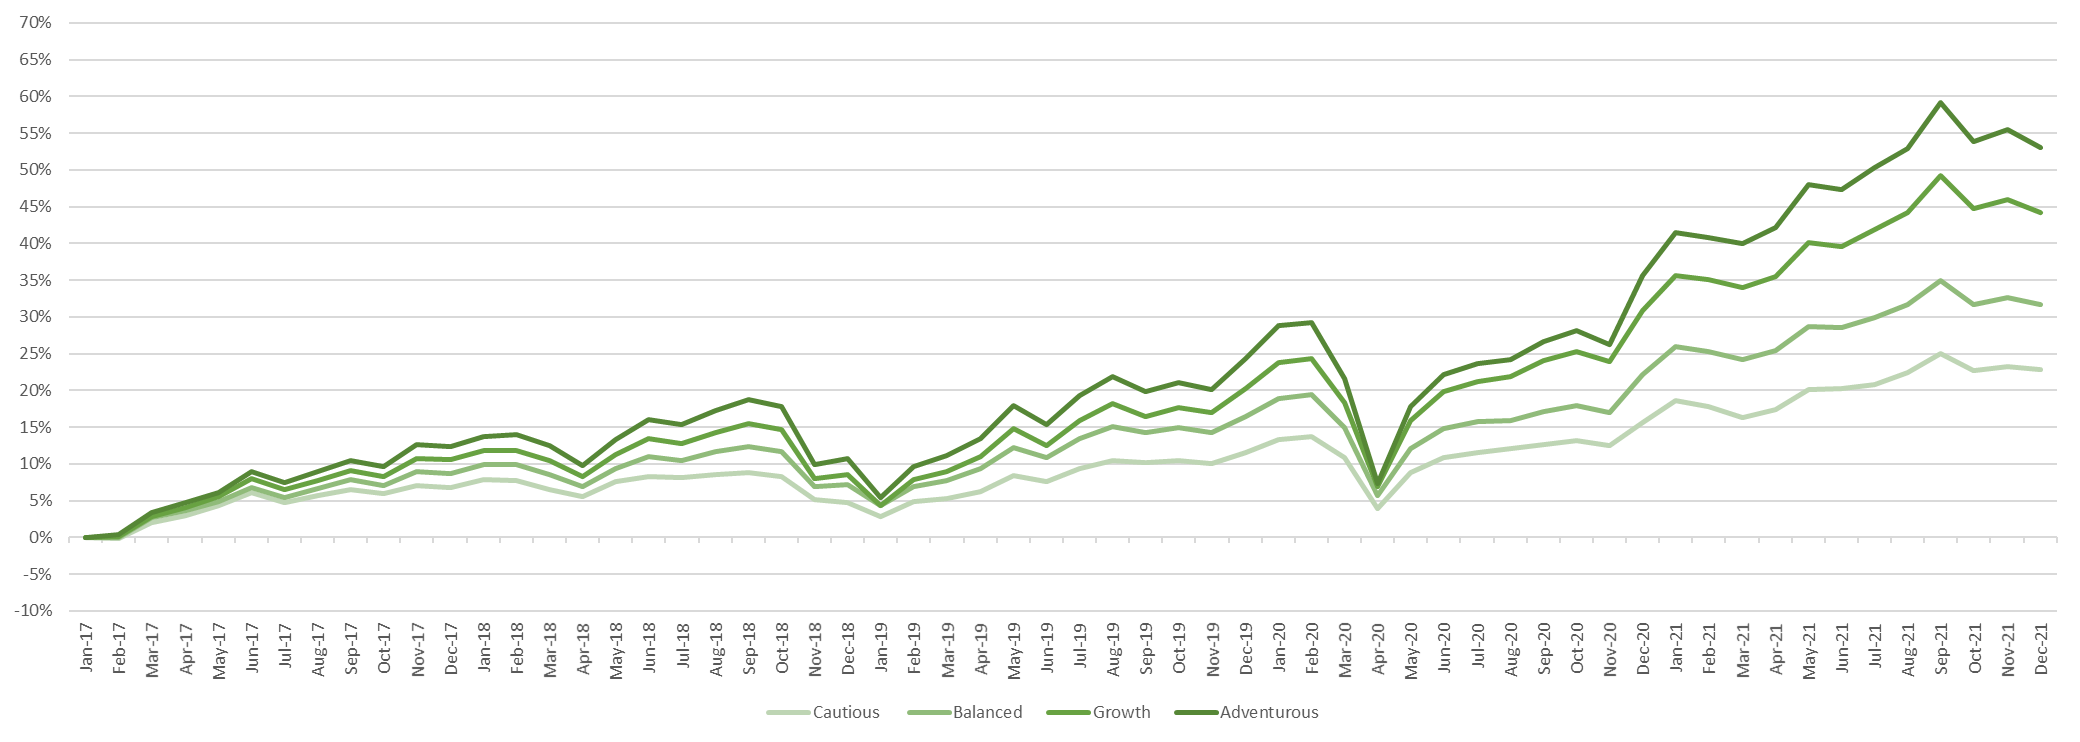
TAM Ethical Five Year Performance
TAM Ethical All Time Performance
Cautious 35/65PORTFOLIO |
Balanced 50/50PORTFOLIO |
Growth 65/35PORTFOLIO |
Adventurous 85/15PORTFOLIO |
|---|---|---|---|
| 44.73% | 45.95% | 62.67% | 83.44% |
Source: TAM Asset Management Ltd. The figures shown above are for TAM’s Ethical portfolio range which will be mirrored by the Ethical portfolios available through Greenfinch. Performance figures shown are from inception (Cautious on 01July 2013, Balanced on 01 January 2014, Growth on 01 April 2014 and Adventurous on 01 November 2013) to 31 December 2021. Past performance is not necessarily a guide to future returns. The value of investments and the income from them, may go down as well as up and may fall below the amount initially invested. This real cumulative achieved performance is net – ie. The numbers include the deduction of all fees.
TAM Mainstream Five Year Performance
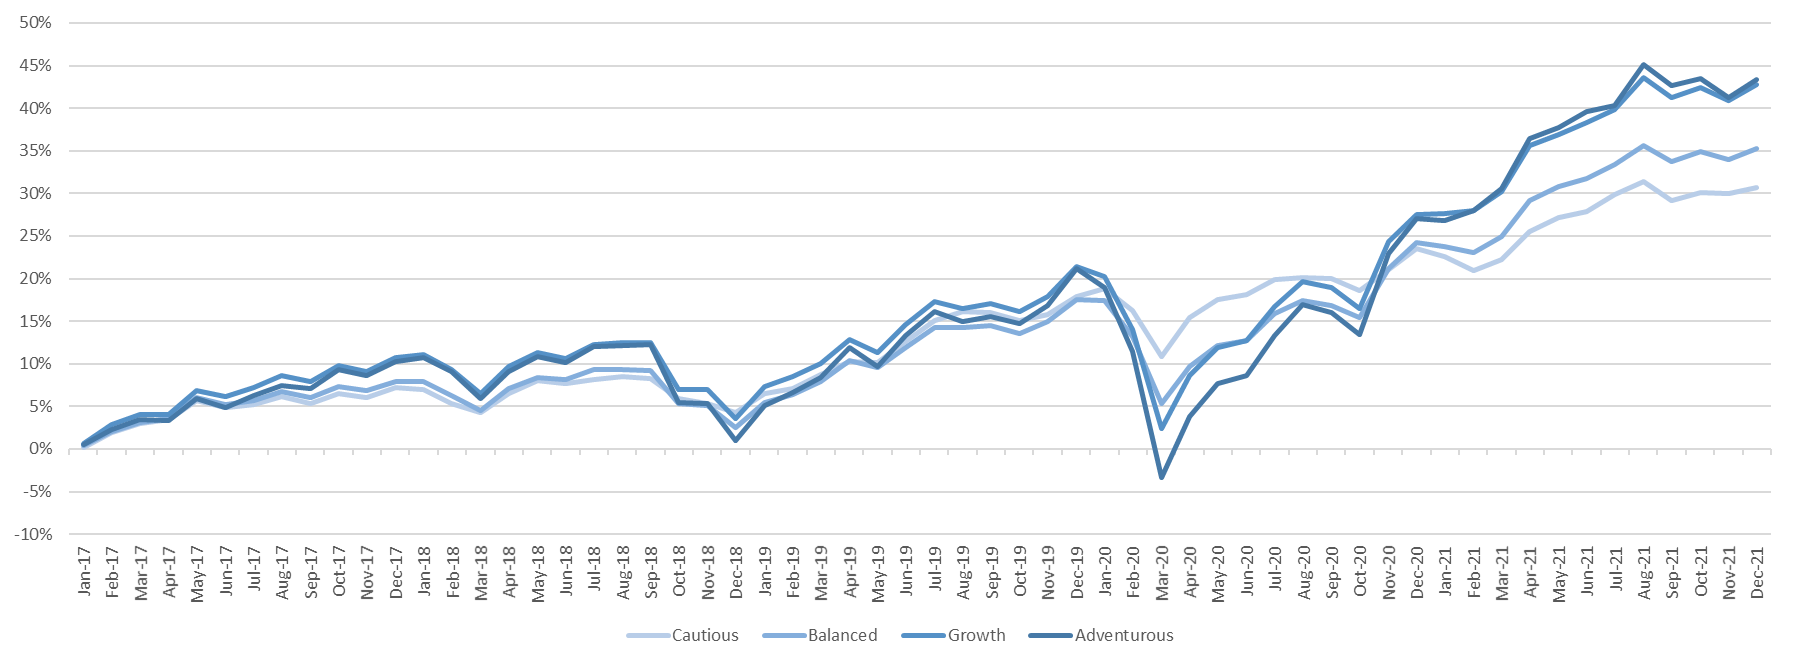
TAM Mainstream All Time Performance
Cautious 35/65PORTFOLIO |
Balanced 50/50PORTFOLIO |
Growth 65/35PORTFOLIO |
Adventurous 85/15PORTFOLIO |
|---|---|---|---|
|
90.70% |
108.61% | 137.83% | 144.67% |
Source: TAM Asset Management Ltd. Figures shown above are for TAM’s existing Mainstream portfolio range which will be mirrored by the Mainstream portfolios available through Greenfinch. Performance figures shown are from inception (Cautious on 01 January 2008, Balanced on 01 July 2008, Growth on 01 October 2011, Adventurous on 01 January 2008) to 31 December 2021. Past performance is not necessarily a guide to future returns. The value of investments and the income from them, may go down as well as up and may fall below the amount initially invested. This real cumulative achieved performance is net – ie. The numbers include the deduction of all fees.